TTFB is not your website’s speed. It’s your server’s confession.
Every performance discussion eventually lands on page load time. But page load time bundles together dozens of variables - your code, your images, third-party scripts, the visitor’s device, the network between them and you.
TTFB strips all of that away. It measures one thing: how long your server takes to start responding after a browser asks for a page.
If your TTFB is slow, nothing downstream can save you. A perfectly optimized front-end on a slow server is still a slow website.
What TTFB actually measures
Time To First Byte is the duration between three events:
- DNS lookup - the browser resolves your domain to an IP address
- TCP/TLS handshake - the browser establishes a secure connection
- Server processing - your server receives the request, executes code, queries the database, and sends back the first byte of the response
Most people think TTFB is just #3. It’s all three. But server processing is the component you have the most control over - and it’s where hosting providers differ the most.
Here’s a rough breakdown on a typical request:
| Component | Fast Host | Slow Host |
|---|---|---|
| DNS lookup | 10–30 ms | 50–200 ms |
| TCP + TLS handshake | 20–50 ms | 50–150 ms |
| Server processing | 30–100 ms | 300–1,500 ms |
| Total TTFB | 60–180 ms | 400–1,850 ms |
That server processing row is where the real gap lives. On a slow host, your server spends 300ms+ just thinking before it sends a single byte. On a tuned stack, it’s done in 30ms.
Why your hosting provider controls most of your TTFB
Your application code matters - a poorly written WordPress theme with 200 database queries will be slow anywhere. But even well-built sites are throttled by the infrastructure underneath them.
Storage speed
Every page request triggers file reads and database queries. If those operations hit a slow disk, they queue up.
- HDD: 80–160 MB/s, high seek latency
- SATA SSD: ~500 MB/s, moderate latency
- NVMe Gen 4: 3,000–7,000 MB/s, sub-10μs latency
On a WordPress site that runs 60 database queries per page, switching from SATA to NVMe storage saves roughly 30ms in storage latency alone - before any code executes.
Web server architecture
Apache spawns a process per connection. On shared hosting with 200 other sites, those processes compete for CPU and memory. Your request waits in line.
LiteSpeed uses an event-driven model - it handles thousands of concurrent connections with a fraction of the resources. More importantly, LiteSpeed’s built-in cache (LSCache) serves cached pages directly from memory. PHP never runs. The database never gets touched. Our LSCache configuration guide walks through the setup step by step.
Cached TTFB on Apache + WP Super Cache: ~200ms (PHP still bootstraps to check the cache) Cached TTFB on LiteSpeed + LSCache: ~30–50ms (served at the server level, zero PHP execution)
That 150ms gap is entirely determined by your hosting stack, not your code.
Server location
Physics still applies. A request from Berlin to a datacenter in Virginia adds ~100ms of round-trip latency that no software optimization can eliminate.
If your audience is in Europe, your server should be in Europe. We run datacenters in Vienna, Nuremberg, and Amsterdam specifically so EU visitors get single-digit-millisecond network hops instead of transatlantic round trips.
Resource contention (the shared hosting problem)
On oversold shared hosting, your site shares CPU, RAM, and I/O bandwidth with hundreds of neighbours. When one site gets a traffic spike, everyone’s TTFB degrades.
Proper hosting isolates accounts at the kernel level - your PHP workers, memory allocation, and I/O throughput are guaranteed, not shared from a common pool.
How to measure your TTFB
Method 1: Chrome DevTools (quickest)
- Open your site in Chrome
- Press
F12→ Network tab - Hard refresh (
Ctrl + Shift + R) - Click the first document request (your page URL)
- Look at Timing → Waiting for server response
That “Waiting” value is your TTFB.
Method 2: WebPageTest.org (most thorough)
Run a test from a location near your target audience. The waterfall chart shows TTFB as the green bar on the first request. Run 3 tests and average the results - single runs can be noisy.
Method 3: curl from the command line
curl -o /dev/null -s -w "TTFB: %{time_starttransfer}s\nTotal: %{time_total}s\n" https://yoursite.comThis gives you the raw TTFB without browser overhead. Run it from a VPS near your target audience for the most accurate reading.
For raw bandwidth measurements to specific datacenters, our Looking Glass lets you test latency and throughput directly from your browser.
What “good” TTFB looks like
Google considers TTFB in their Core Web Vitals assessment as a diagnostic metric for Largest Contentful Paint (LCP). Their thresholds:
| Rating | TTFB |
|---|---|
| ✅ Good | Under 800 ms |
| ⚠️ Needs improvement | 800–1,800 ms |
| ❌ Poor | Over 1,800 ms |
Those thresholds are generous. In practice, competitive sites target under 200ms TTFB for cached pages and under 600ms for dynamic, uncached requests.
On GOZEN’s stack, we regularly see:
- Cached pages: 30–80ms TTFB
- Dynamic WordPress pages: 150–400ms TTFB
- Complex WooCommerce pages: 200–500ms TTFB
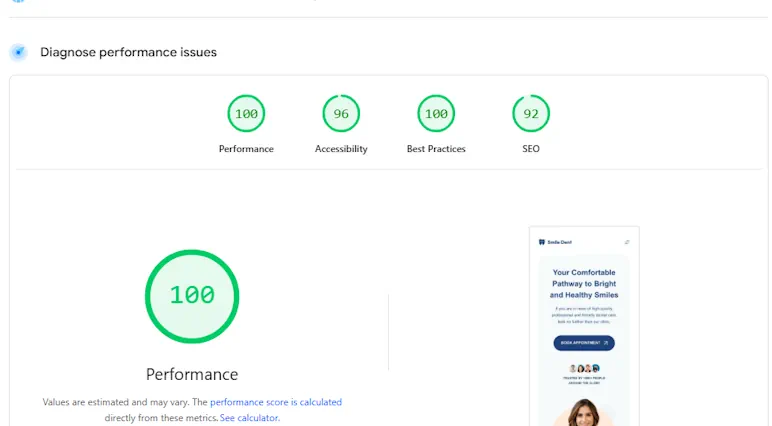
Our server benchmark scores document this with real test data - 9.4/10 server performance score, 100/100 Lighthouse desktop.
What you can do about slow TTFB
If your TTFB is above 800ms (poor)
Your hosting is the bottleneck. No plugin or code optimization will fix infrastructure-level latency. Switch to a host that runs NVMe storage, LiteSpeed (or nginx with FastCGI cache), and proper resource isolation.
If your TTFB is 200–800ms (mediocre)
- Enable page caching - LSCache, WP Super Cache, or nginx FastCGI cache. Cached responses should drop TTFB under 100ms.
- Enable object caching - Redis or Memcached for database query results. This helps pages that can’t be full-page cached (carts, dashboards).
- Audit your plugins - each active WordPress plugin adds PHP execution time. Deactivate, measure, re-activate one by one.
- Check your PHP version - PHP 8.2+ is measurably faster than 7.4 for the same code. See our PHP configuration guide for switching versions in cPanel.
For a complete optimization walkthrough, our WordPress Speed Optimization playbook covers the full stack layer by layer.
If your TTFB is under 200ms (good)
You’re in solid shape. Focus on front-end optimization - image formats, critical CSS, font loading - to push your full page load under 2 seconds.
The uncomfortable truth
TTFB is the one metric your hosting provider can’t hide behind marketing. You can measure it in 10 seconds with a browser. It doesn’t lie, and it doesn’t improve with a caching plugin when the underlying server is saturated.
If your TTFB is consistently above 400ms on a cached page, you don’t have a code problem. You have a hosting problem.
Ready to see what proper infrastructure looks like? View our hosting plans → - NVMe Gen 4, LiteSpeed, resource isolation, and free migration from your current provider.
Built for speed. Priced for growth.
NVMe Gen 4 storage, LiteSpeed, 99.9% uptime SLA. Starting at $4.00/mo.
Dorian K. writes about hosting infrastructure, performance, and migrations at GOZEN HOST LLC, a Top 25 WordPress Hosting Provider for 2026 (HostAdvice), covering the tools that keep your business online.
Last updated: Apr 14, 2026